So, I've been doing background research for the past week about applying this program. The first topic I'm looking into is optics, and the book I'm reading about this is "Applications of Non-Linear Fiber Optics" by Govind P. Agrawal. The current application I'm working with involves not solitons, but continuous waves (I'll be doing solitons later). Specifically, the equation comes from nonlinear dispersion curves (detailing continuous wave beams). After solving a nonlinear coupled-mode equation by assuming constant refraction index and a model for the total power of the forward and backward propagating waves, we can derive the Nonlinear-Schroedinger Equation. Furthermore, using a multiple-scale method (more on that later), we can prove equivalence between the linear and nonlinear case using this equation (essentially, a part of the equations drops to 0 for the nonlinear case).
Once equivalence is demonstrated, we describe the equation and the variables within. I'll post the equation as it's written in Agrawal's book once I get the LaTex add-on on my computer (I've been having comp trouble all week). Once I get that on, I'll describe the variables and how we can manipulate the equation to demonstrate different physical properties.
07 July 2008
22 June 2008
Work
Ugh...
Organizing my results; reading some textbooks about non-linear optics; getting my presentation ready.
Organizing my results; reading some textbooks about non-linear optics; getting my presentation ready.
18 June 2008
Running Equations
So, I've worked out a few bugs with the program. Some times, it would spit out both the initial conditions and the results in (ye) such that my analysis was sometimes incorrect. I fixed some of the logic statements in the program and that cleared up the issue. Later, as I was testing a few other equations, I was getting problems that I hadn't seen before. The lines of code that were generating the error were in both my code and ode45. After tinkering with it for a bit, I changed the solver to ode113 and that seemed to clear up the issue.
I would like to note, however, that some of the equations will generate complex answers. It graphs according to the real part, and I do not think it does any analysis of the unreal part. I think this is what caused the problem with ode45. I will redo some of my analysis of earlier equations to ensure that my answers are consistent.
In the mean time, I've been conducting some background research to give me a better basis for both presenting the material and analyzing my results. Specifically, I need to explain how these equations arise naturally, what the initial conditions mean, and what my data indicates. For this reason, I started looking at the Quantum Optics book.
12 June 2008
Program Now Works!
So I got my program to work last night and was doing some number crunching today along with some background research. Here are some interesting bifurcation diagrams I've made so far.
This one (below) demonstrates when you have a particular set symmetrical equations. As I mess around with the parameters it does some of this (notice that the region in the lower left hand corner of the graph towards the origin)...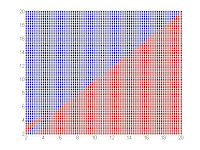 And this, where it would appear as if the region bulges outwards and forms a quarter of a circle...
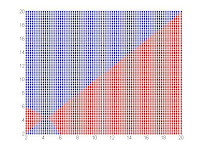
At a certain point, however, the entire graph turns suddenly blue. I'm toying around with the numbers to see what happens. Also, I'm going to modify my program so it has different colors indicating not only which line terminates the system, but also if it crosses 0r not. I'll upload some images with the formal equations tomorrow (right now I'm using a computer without LaTex on it).
This one (below) demonstrates when you have a particular set symmetrical equations. As I mess around with the parameters it does some of this (notice that the region in the lower left hand corner of the graph towards the origin)...
 And this, where it would appear as if the region bulges outwards and forms a quarter of a circle...
At a certain point, however, the entire graph turns suddenly blue. I'm toying around with the numbers to see what happens. Also, I'm going to modify my program so it has different colors indicating not only which line terminates the system, but also if it crosses 0r not. I'll upload some images with the formal equations tomorrow (right now I'm using a computer without LaTex on it).
09 June 2008
Programming Trouble
So, the program nears completion, however, I anticipated that it would be done by today at the latest. There are still some bugs to fix. First, it is not robust doing the step size... it claims I'm trying to make a matrix of non-integer values (which I'm not). I think it's the program, since it works with only some step sizes, but not all. Another problem, which is an integral part of the program, is getting it to graph in two colors. We can then infer the location of the bifurcation line as the region where the points change color.
Fortunately, the program as is should be easy to convert to the 3-D case, which should be interesting (I don't know how I'd graph that, but then again, I have some time to think about it). I'm only worried that MatLab will be just finicky with the program and not want to do it.
I'm going to see if I can resolve these problems tonight, then I'll do some more background research and applications. By the way, here's an interesting link about its applications.
It doesn't explicitly talk about how it applies, but it gives the gist of what's going on during this natural process. The nonlinear equation comes into play here...
Well, that's it for now; I better get cracking at this thing if I want it to be handle equations like that one above for any case...
06 June 2008
First Post
 So, I am near finishing my programming. There are some bugs left with the logical statement I am using for the bifurcation diagram (including getting the program to write the correct 'te' value in the data matrix). I can get it to plot some points, but I'm sure that some of these points are not correct values. I will post later to indicate what my progress is on these problems.
I stumbled through a few interesting obstacles today. I streamlined some of the code, and I figured out h
 ow to get the plot function to work. My first graph looked more like some cellular-biology phenomenon more than a bifurcation diagram. After reworking the code, I got something a bit better. I know that the values are wrong, but it looks like it's getting there. I suspect that I'll have to crank out some work this weekend to get the program done by Monday.
Subscribe to:
Posts (Atom)